March 04, 2016
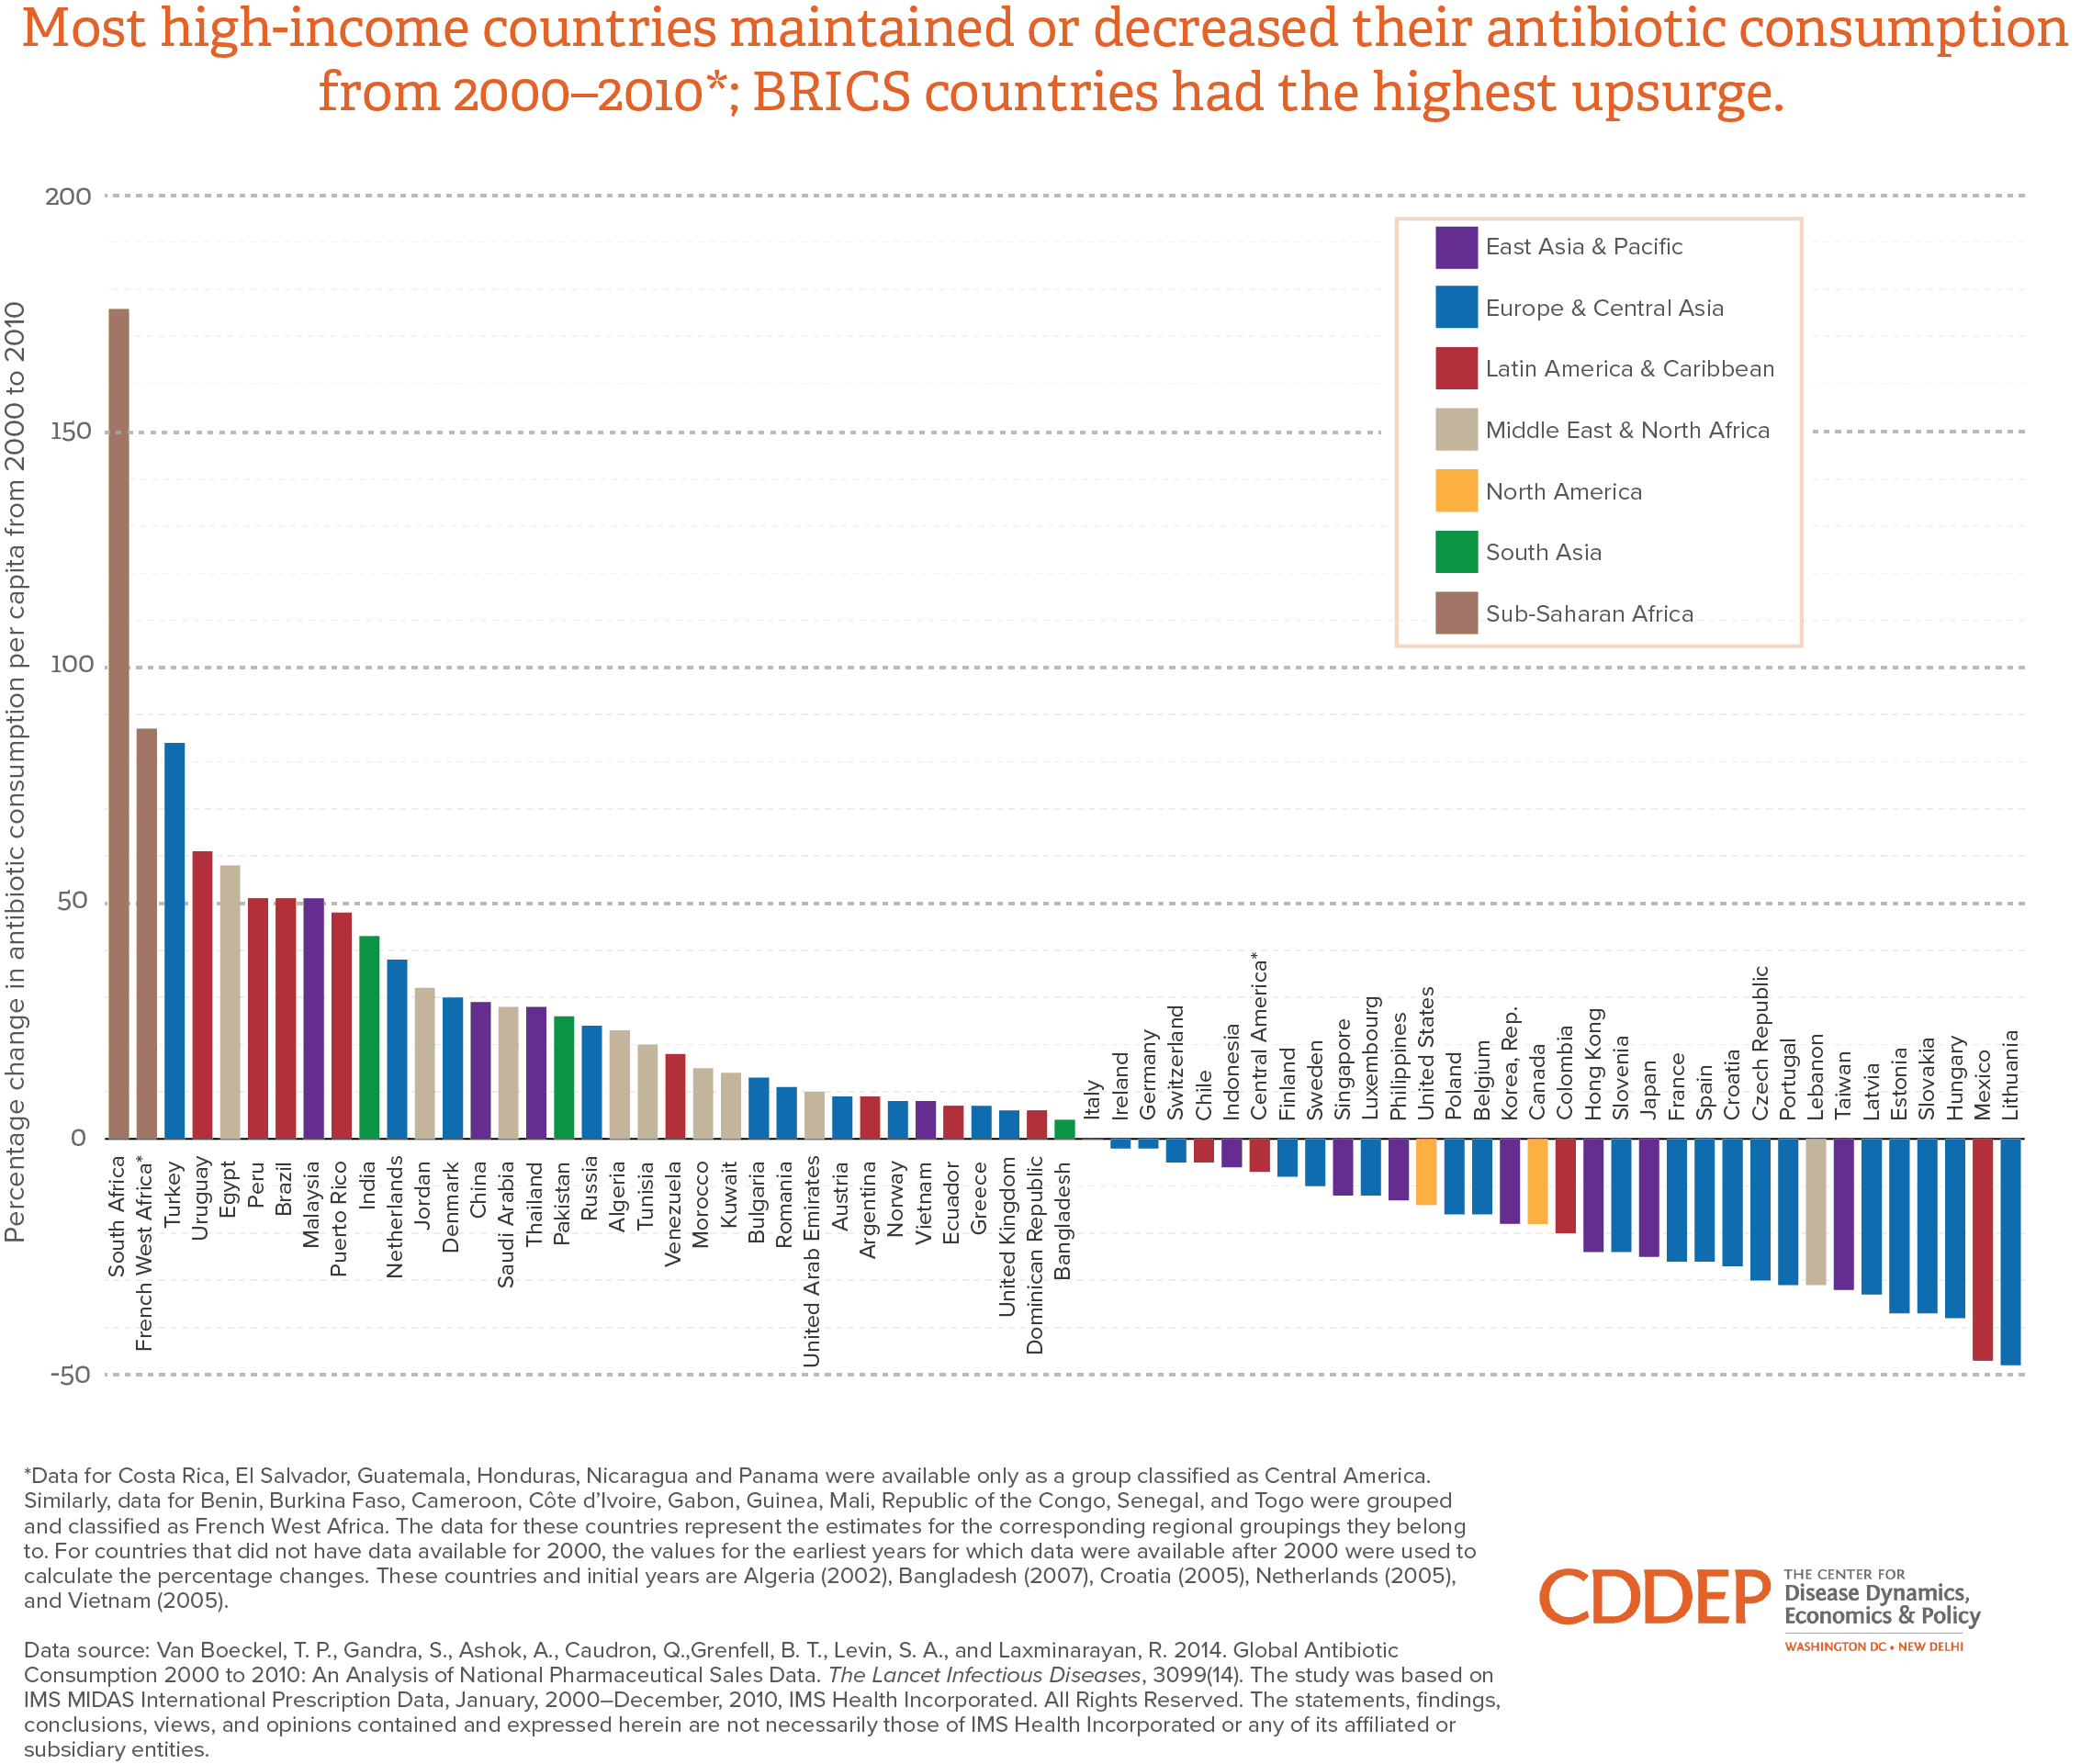
Column graph shows percent change in antibiotic consumption for selected countries from 2000-2010; BRICS (Brazil, Russia, India, China, South Africa) countries show the highest percentage change. Most countries showing a decrease or maintenance in consumption are high-income countries. Data sourced from Van Boeckel et al, 2014: “Global Antibiotic Consumption 2000 to 2010: An Analysis of National Pharmaceutical Sales Data.”